
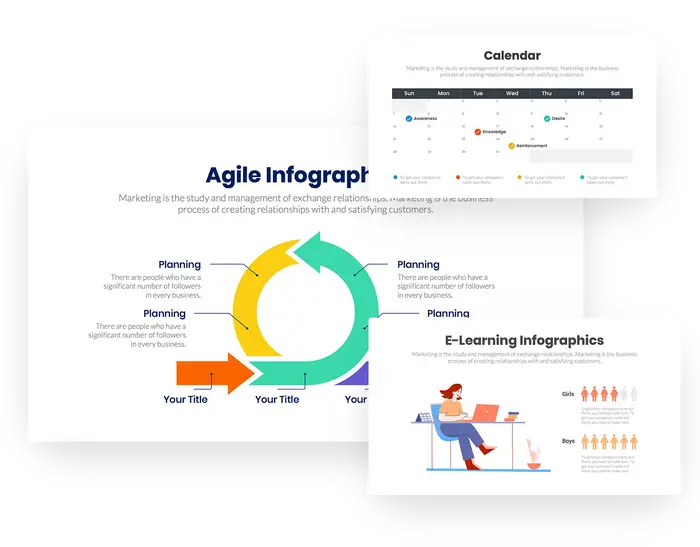
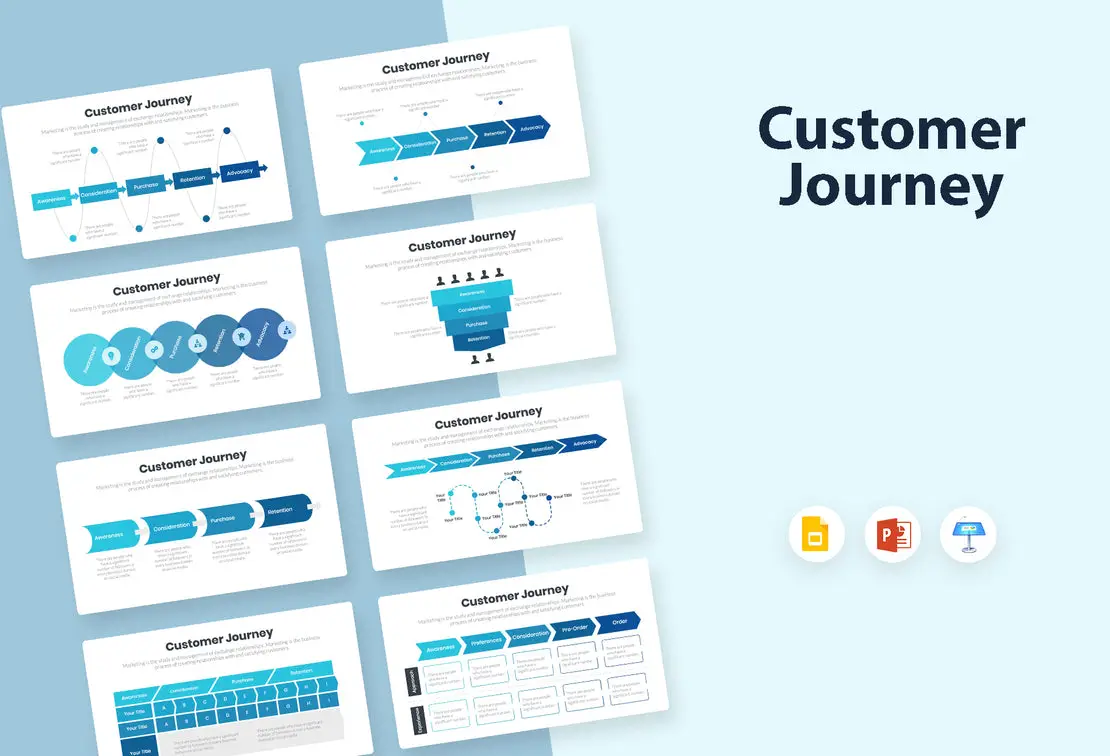
Transform your presentations, reports, and proposals into visual masterpieces with 9500+ Premium Infographics.
No Skills Required. No Monthly Subscriptions.
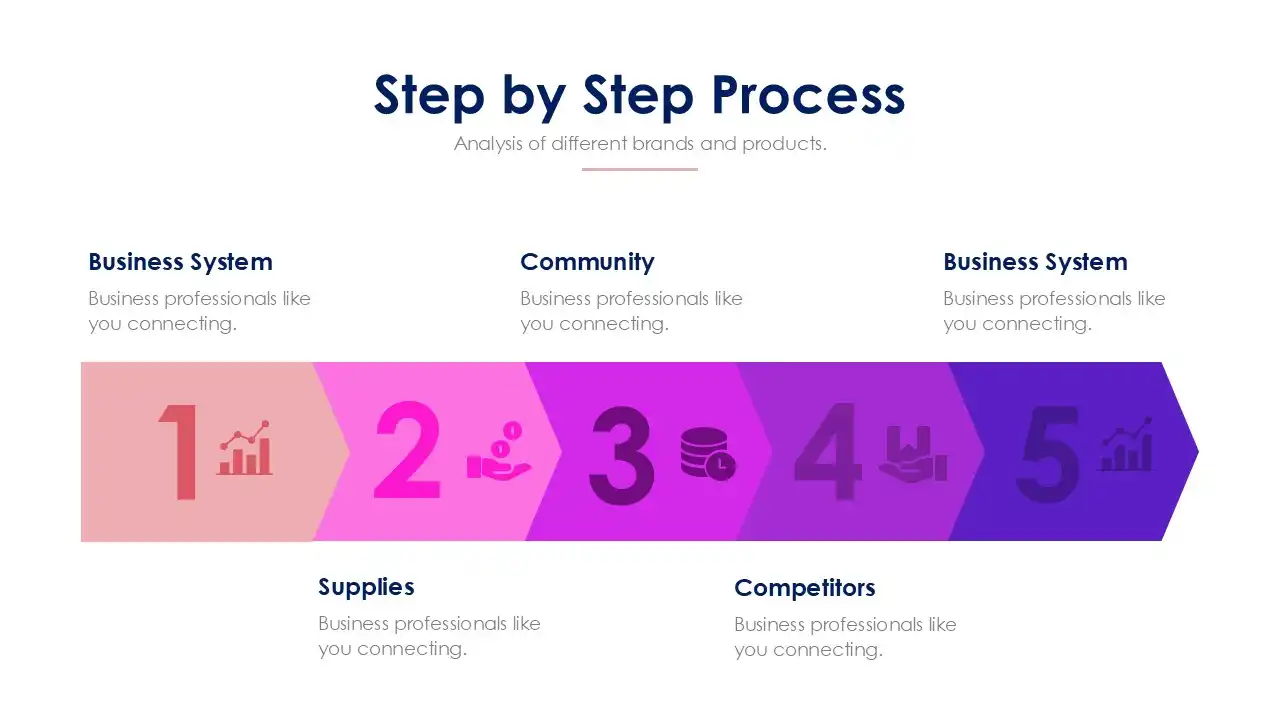
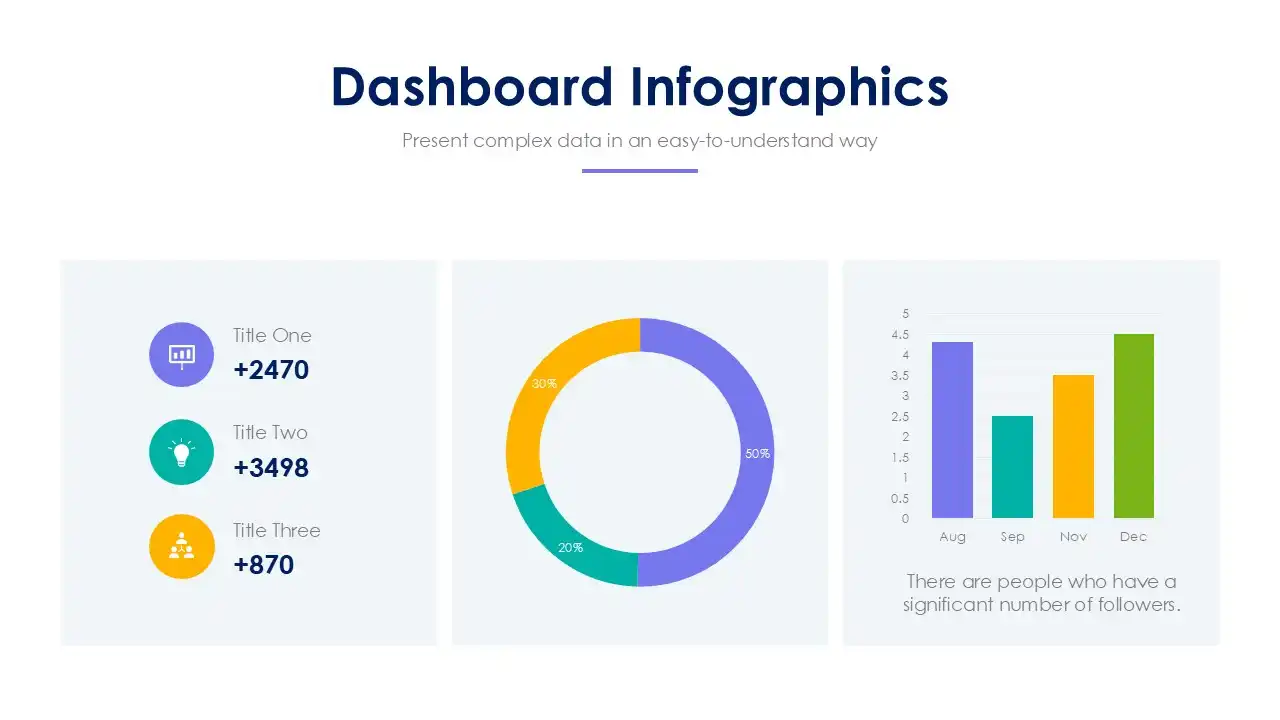
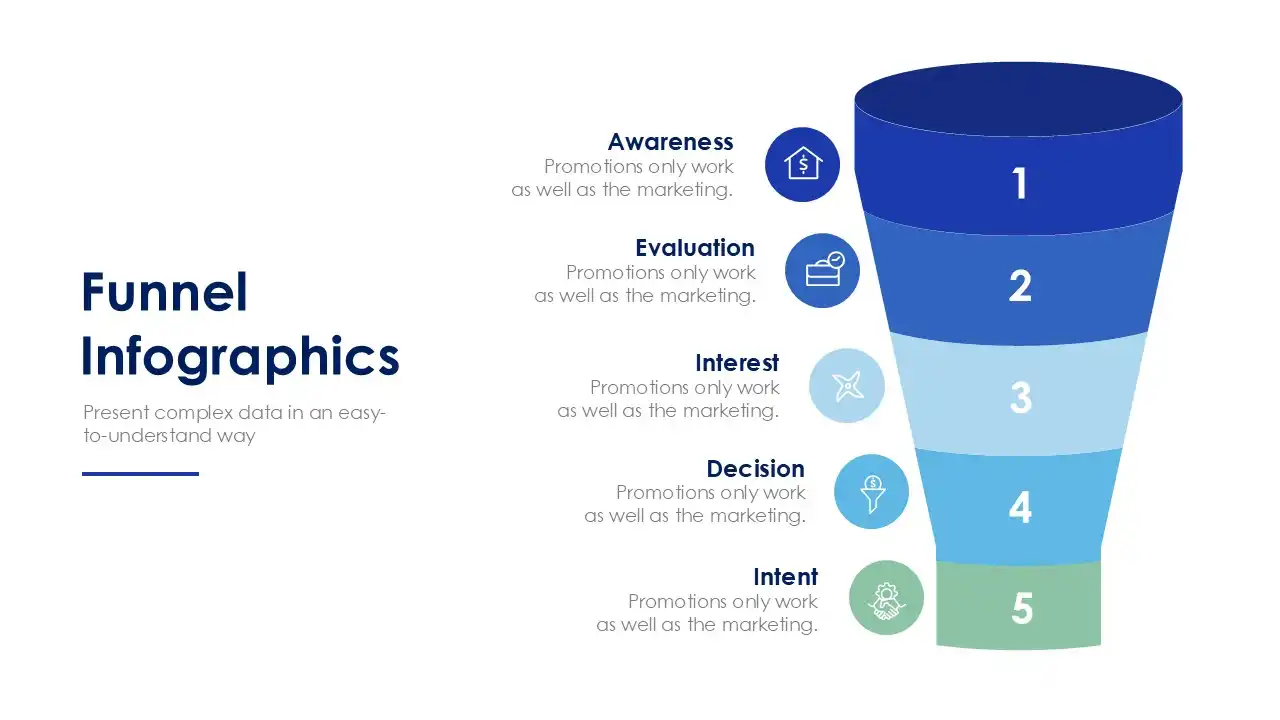
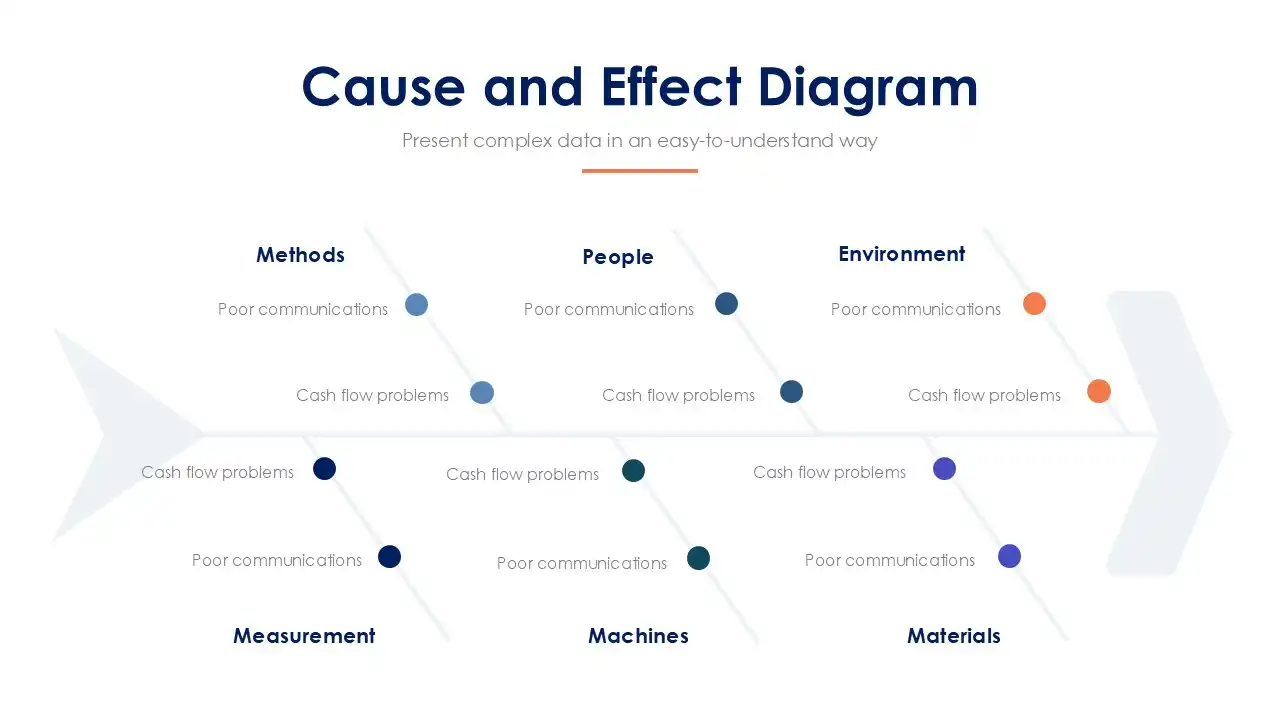
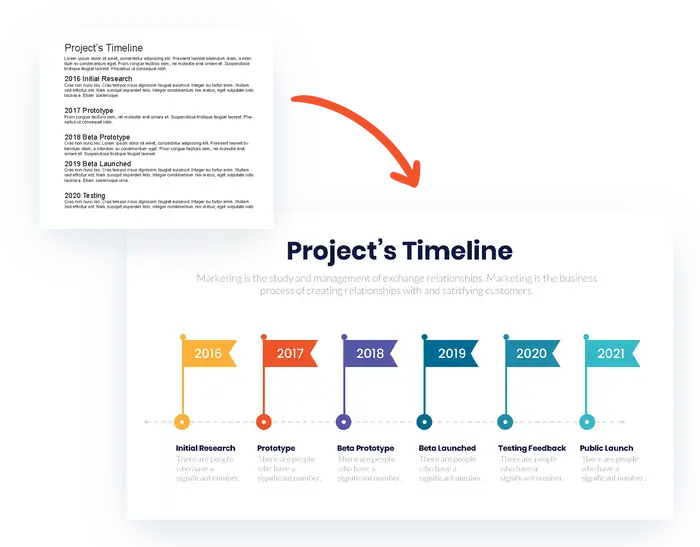
Create content that is both easy to understand and quick to digest.
Fast track your workflow with thousands of professional templates.
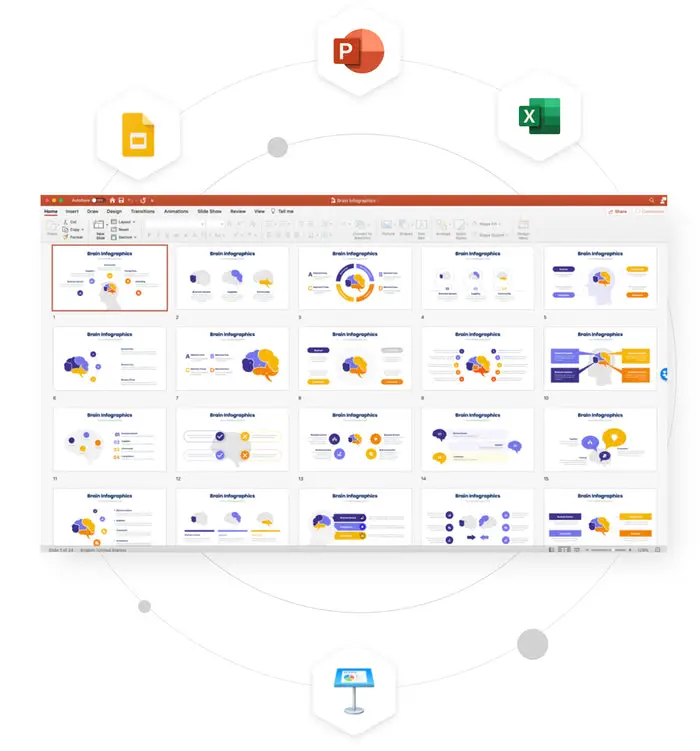
Slideloom works wherever you do.
Usually $198/year. TODAY JUST $49 ONE-TIME PAYMENT.
Limited Time Only.
Usually $198/year. TODAY JUST $49 ONE-TIME PAYMENT.
Limited Time Only.
This is a one-time payment. No monthly/annual membership. With your investment, you’ll be getting ALL our current Slideloom products plus periodical updates free of charge!
You’ll get your content instantly in your inbox. You can also create an account with Slideloom.
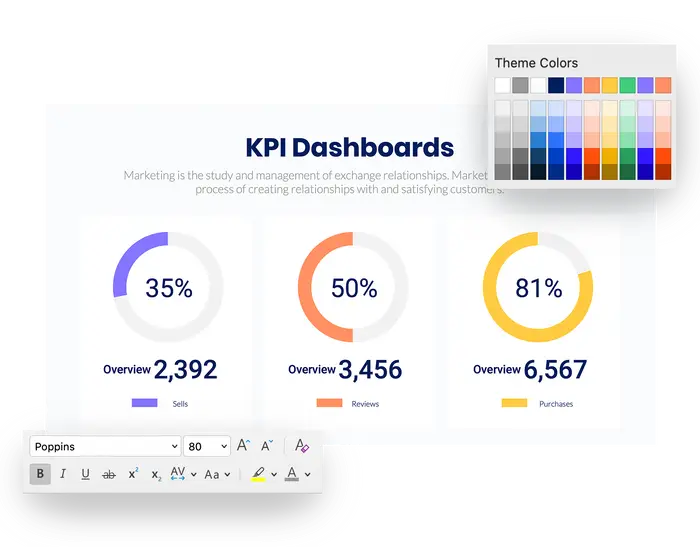
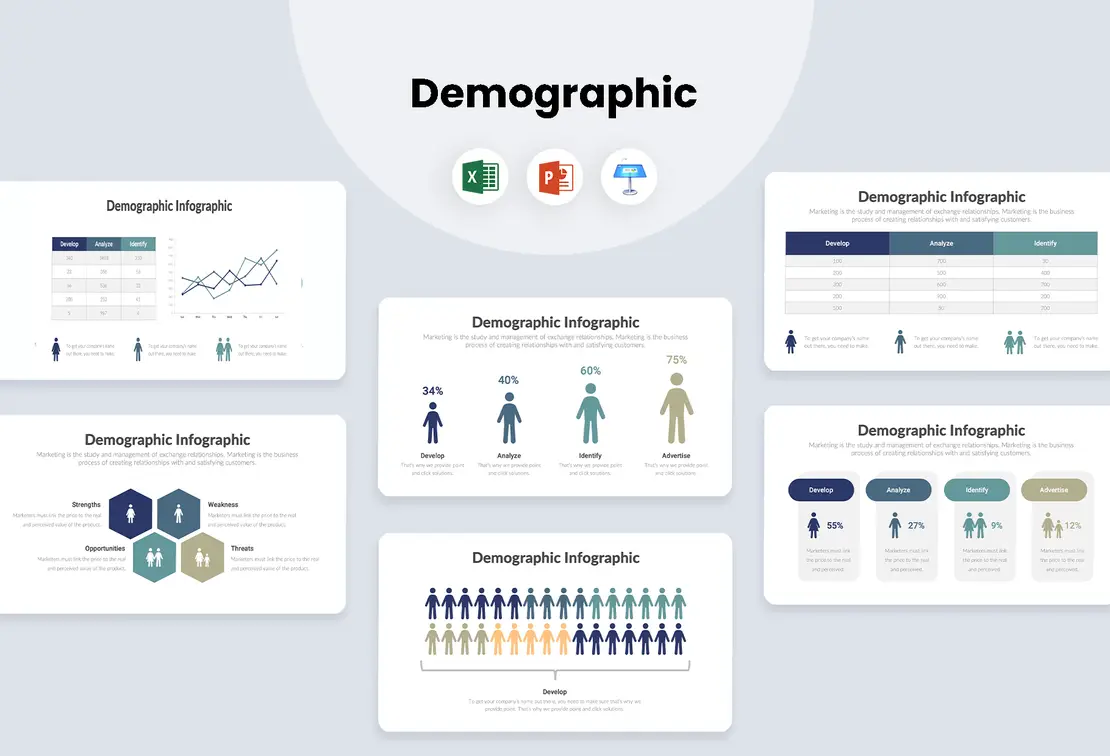
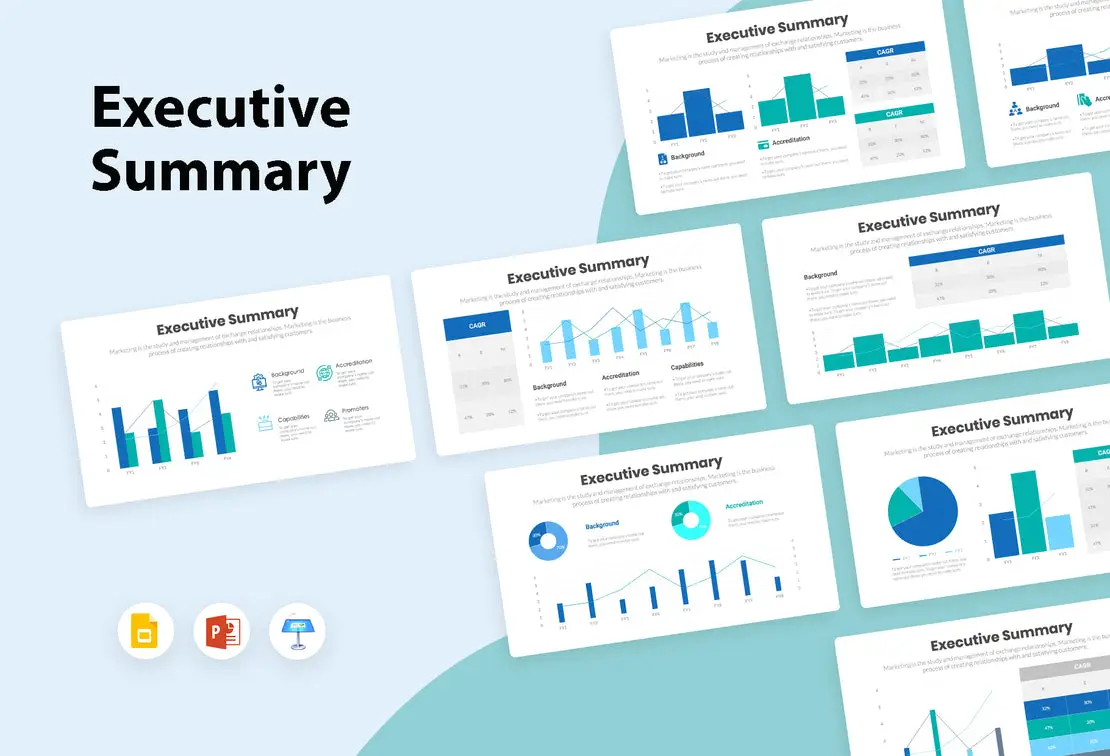
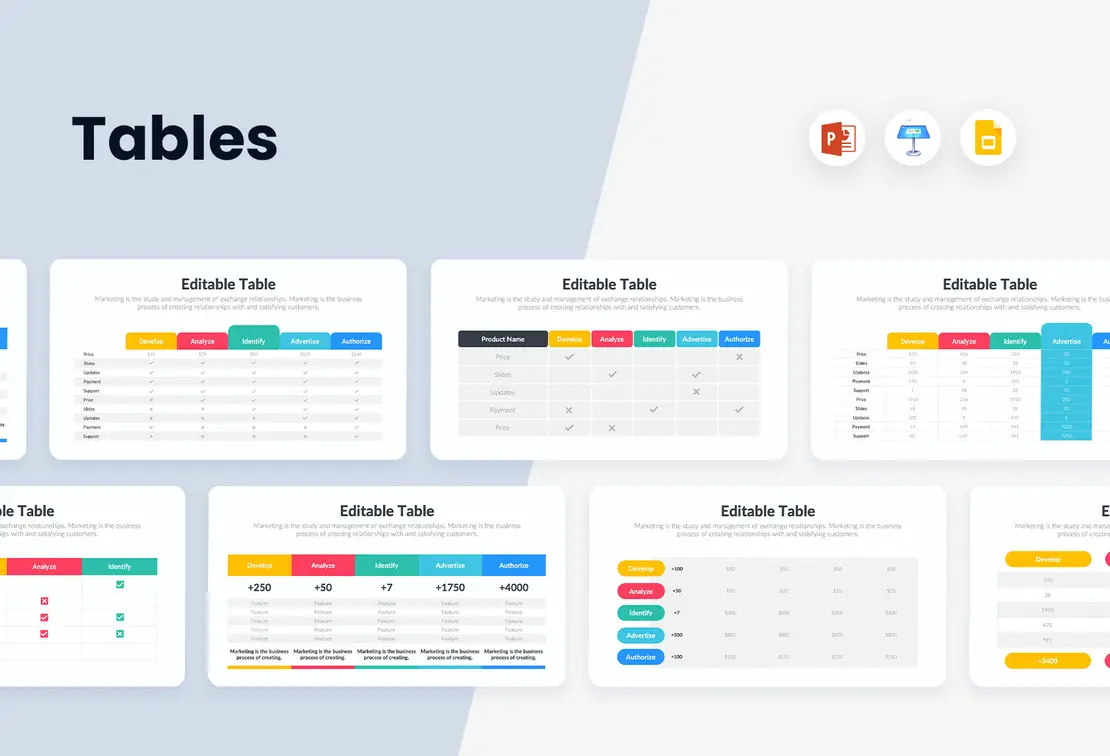
Yes they are. Just right click on the element then choose edit data. The excel spreadsheet will pop up and it will automatically enable you to change the values.
The devices are unlimited in any of the licenses as long as the owner of the license is the only one who accesses the Slideloom account.
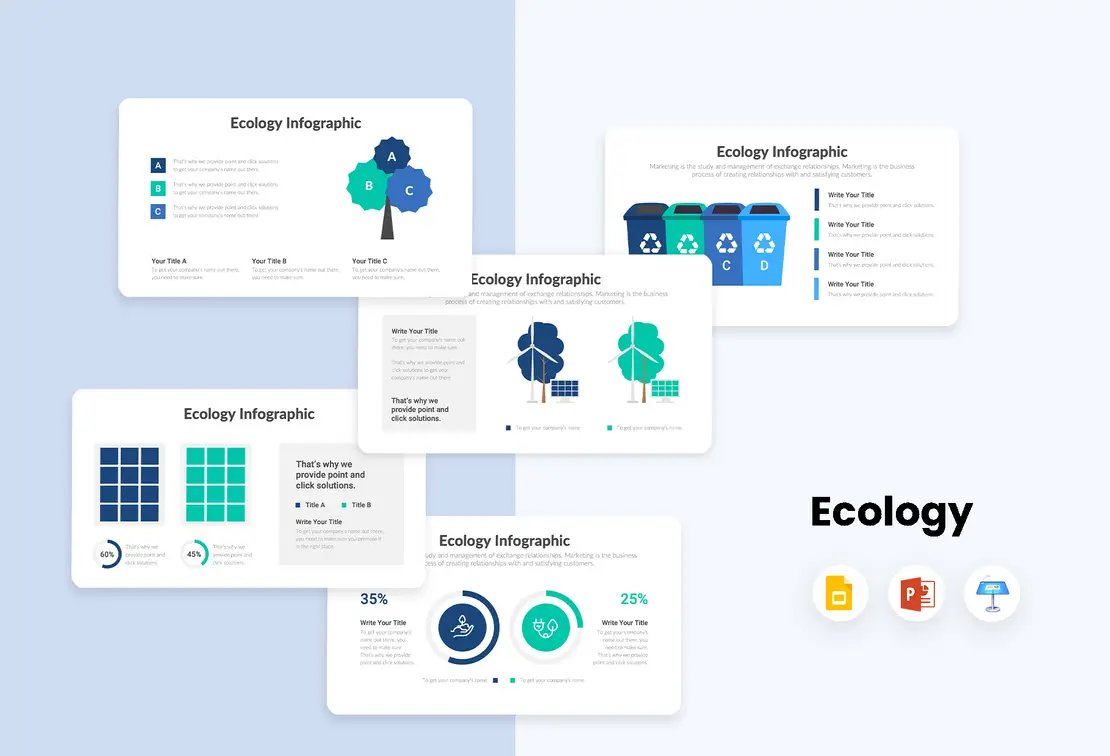
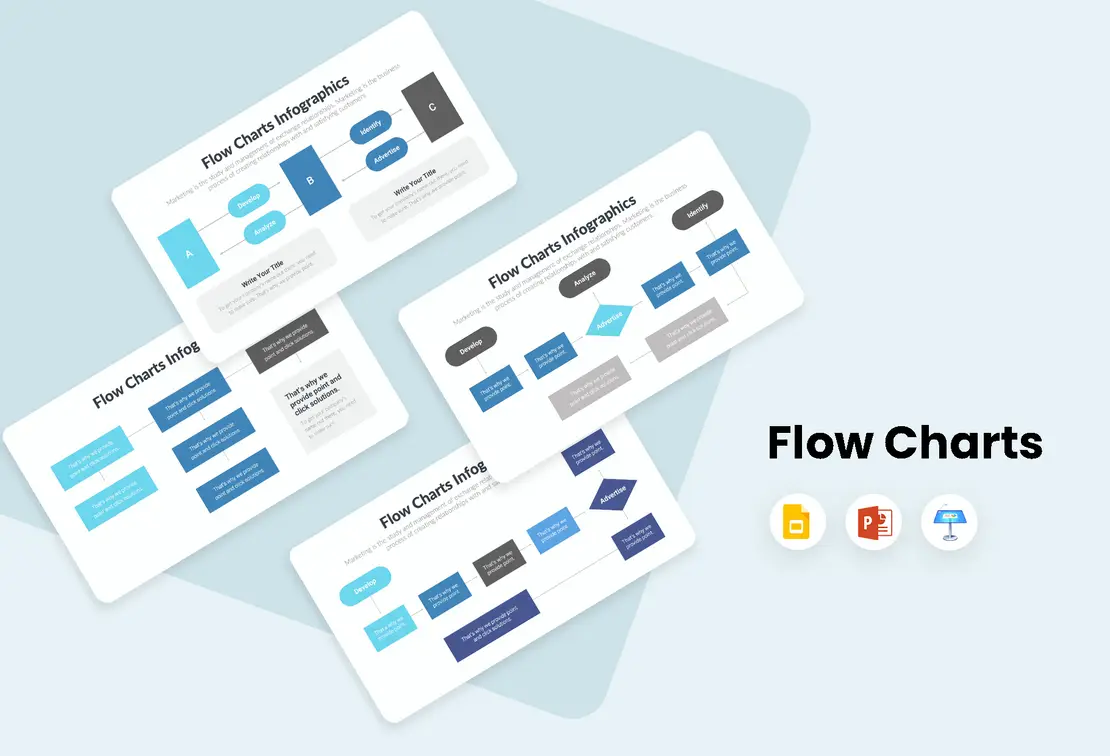
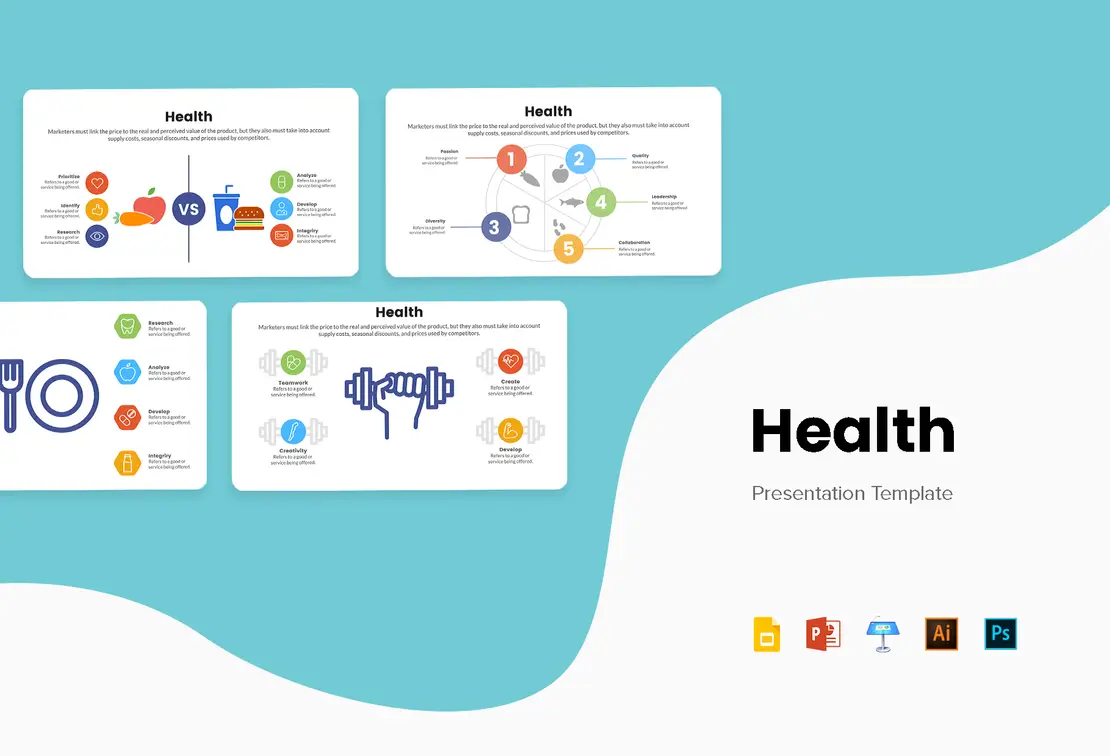
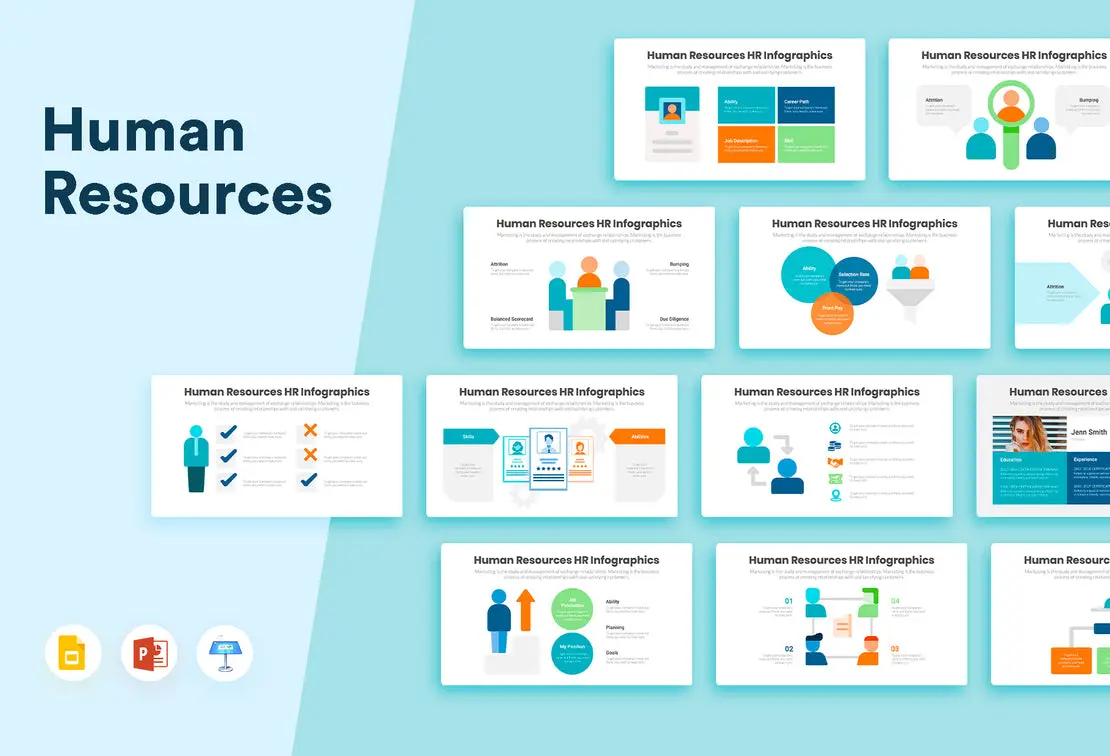
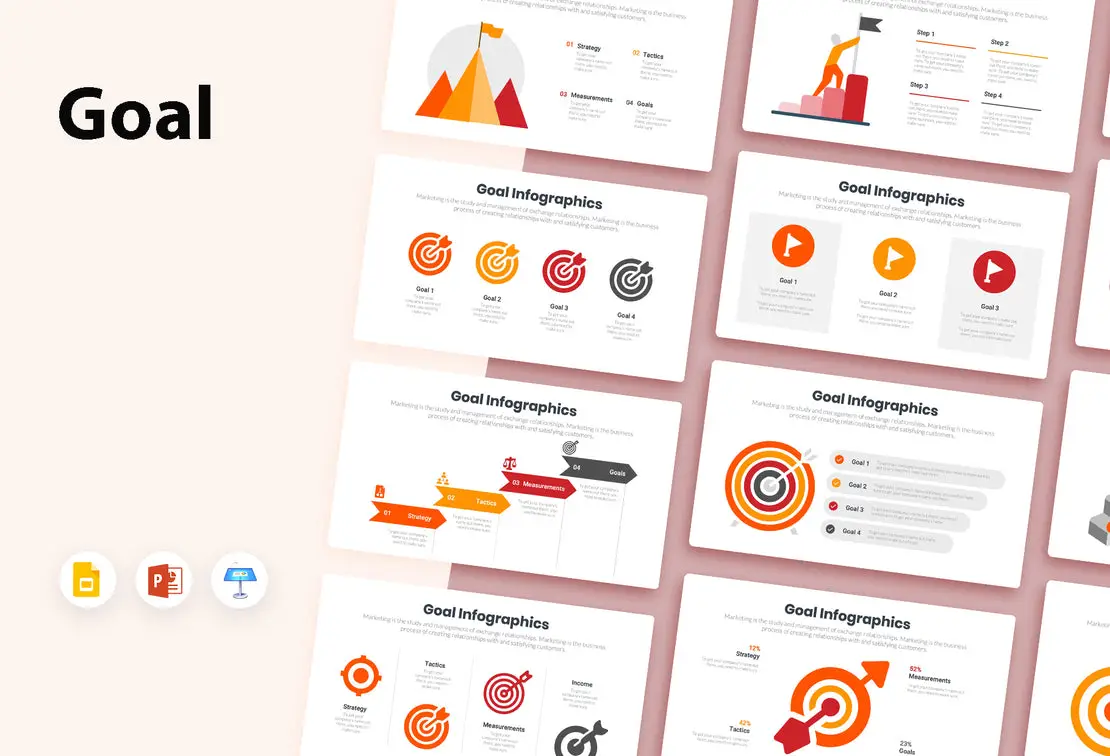
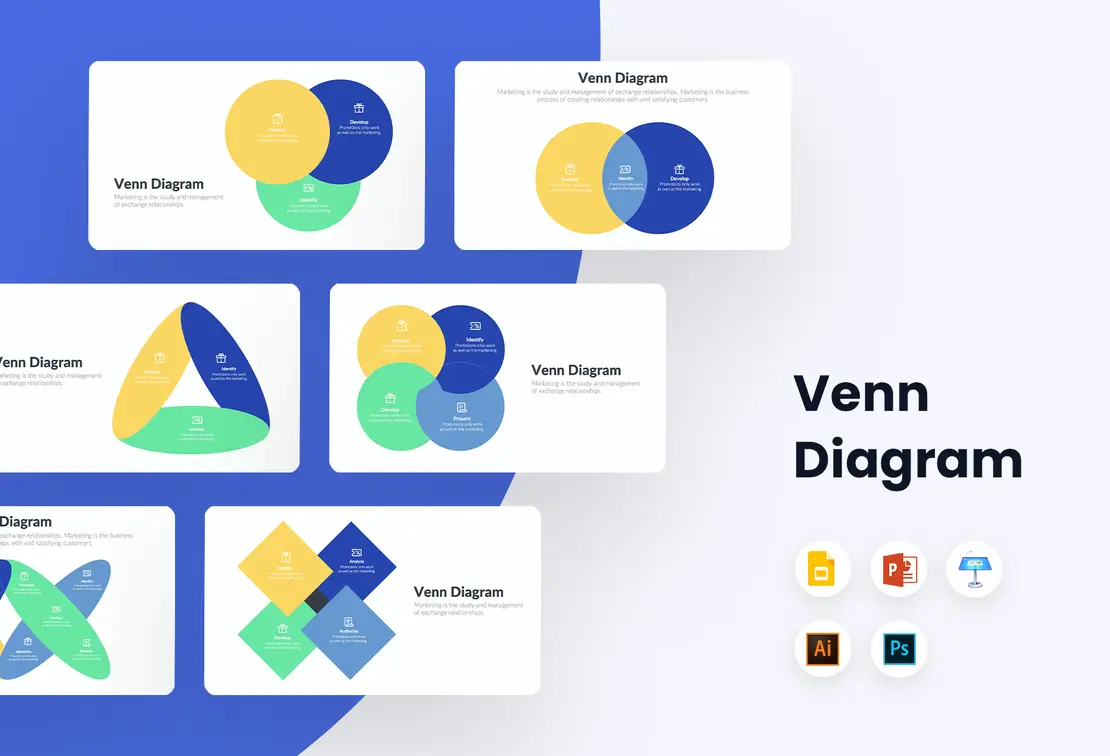
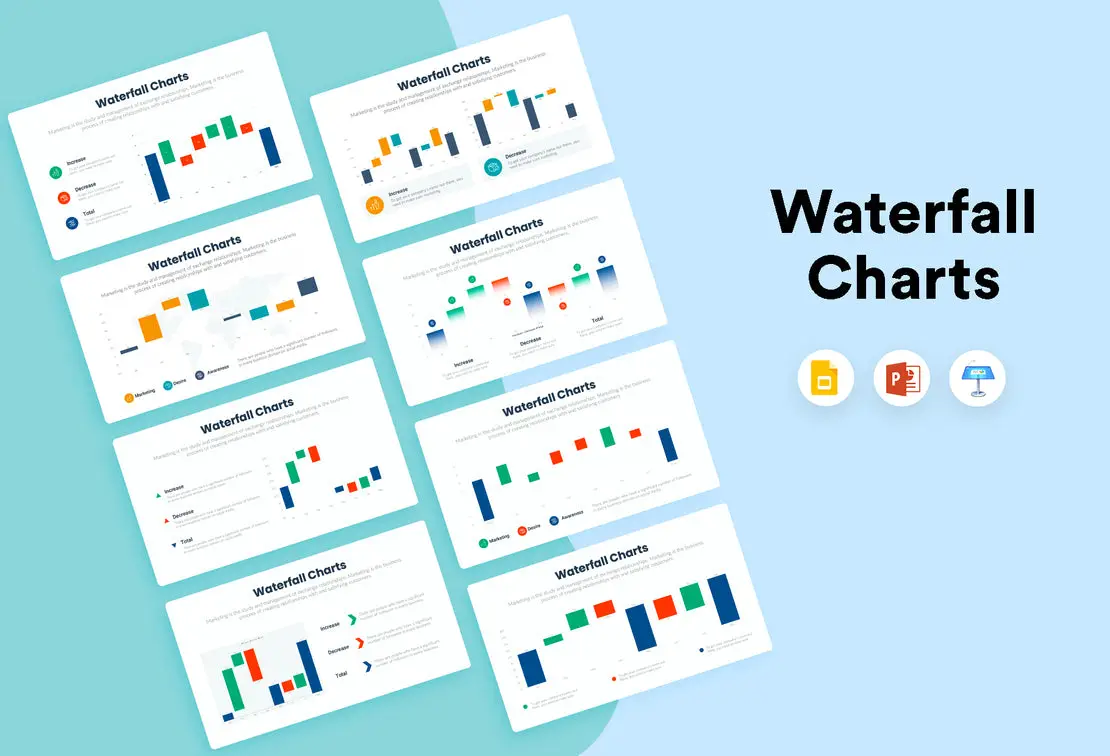
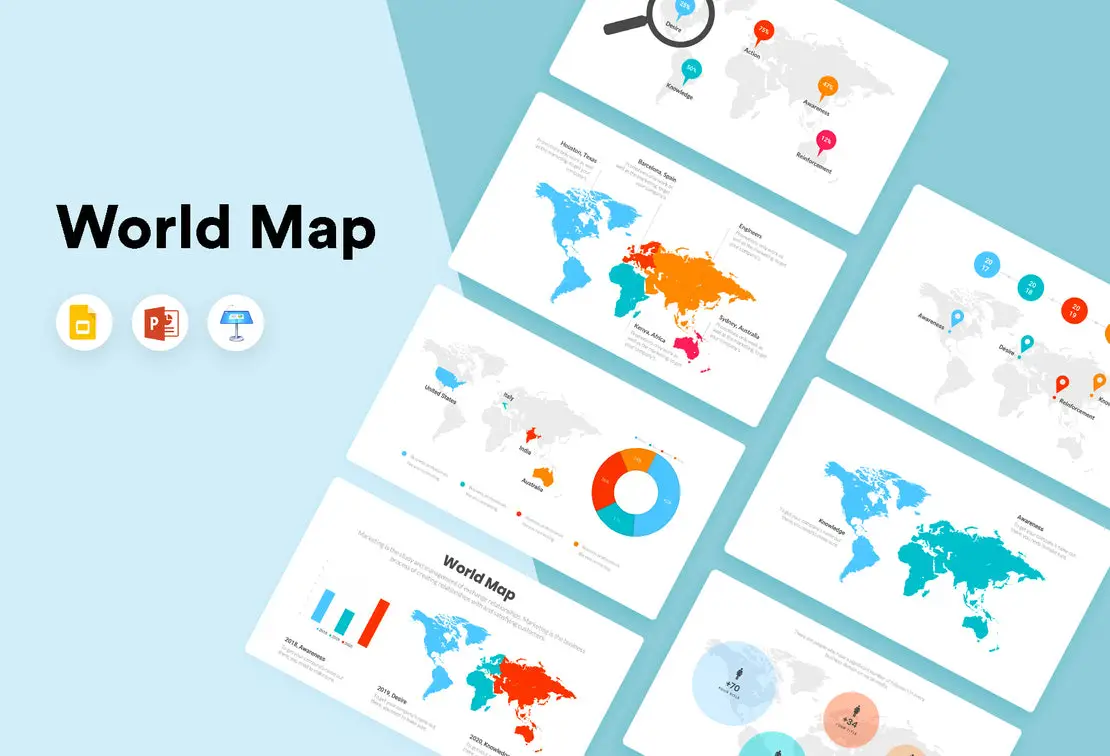
PowerPoint, Google Slides and Keynote
We update our Slideloom library once a week (sometimes twice!). You’ll get an email. Every update is free!