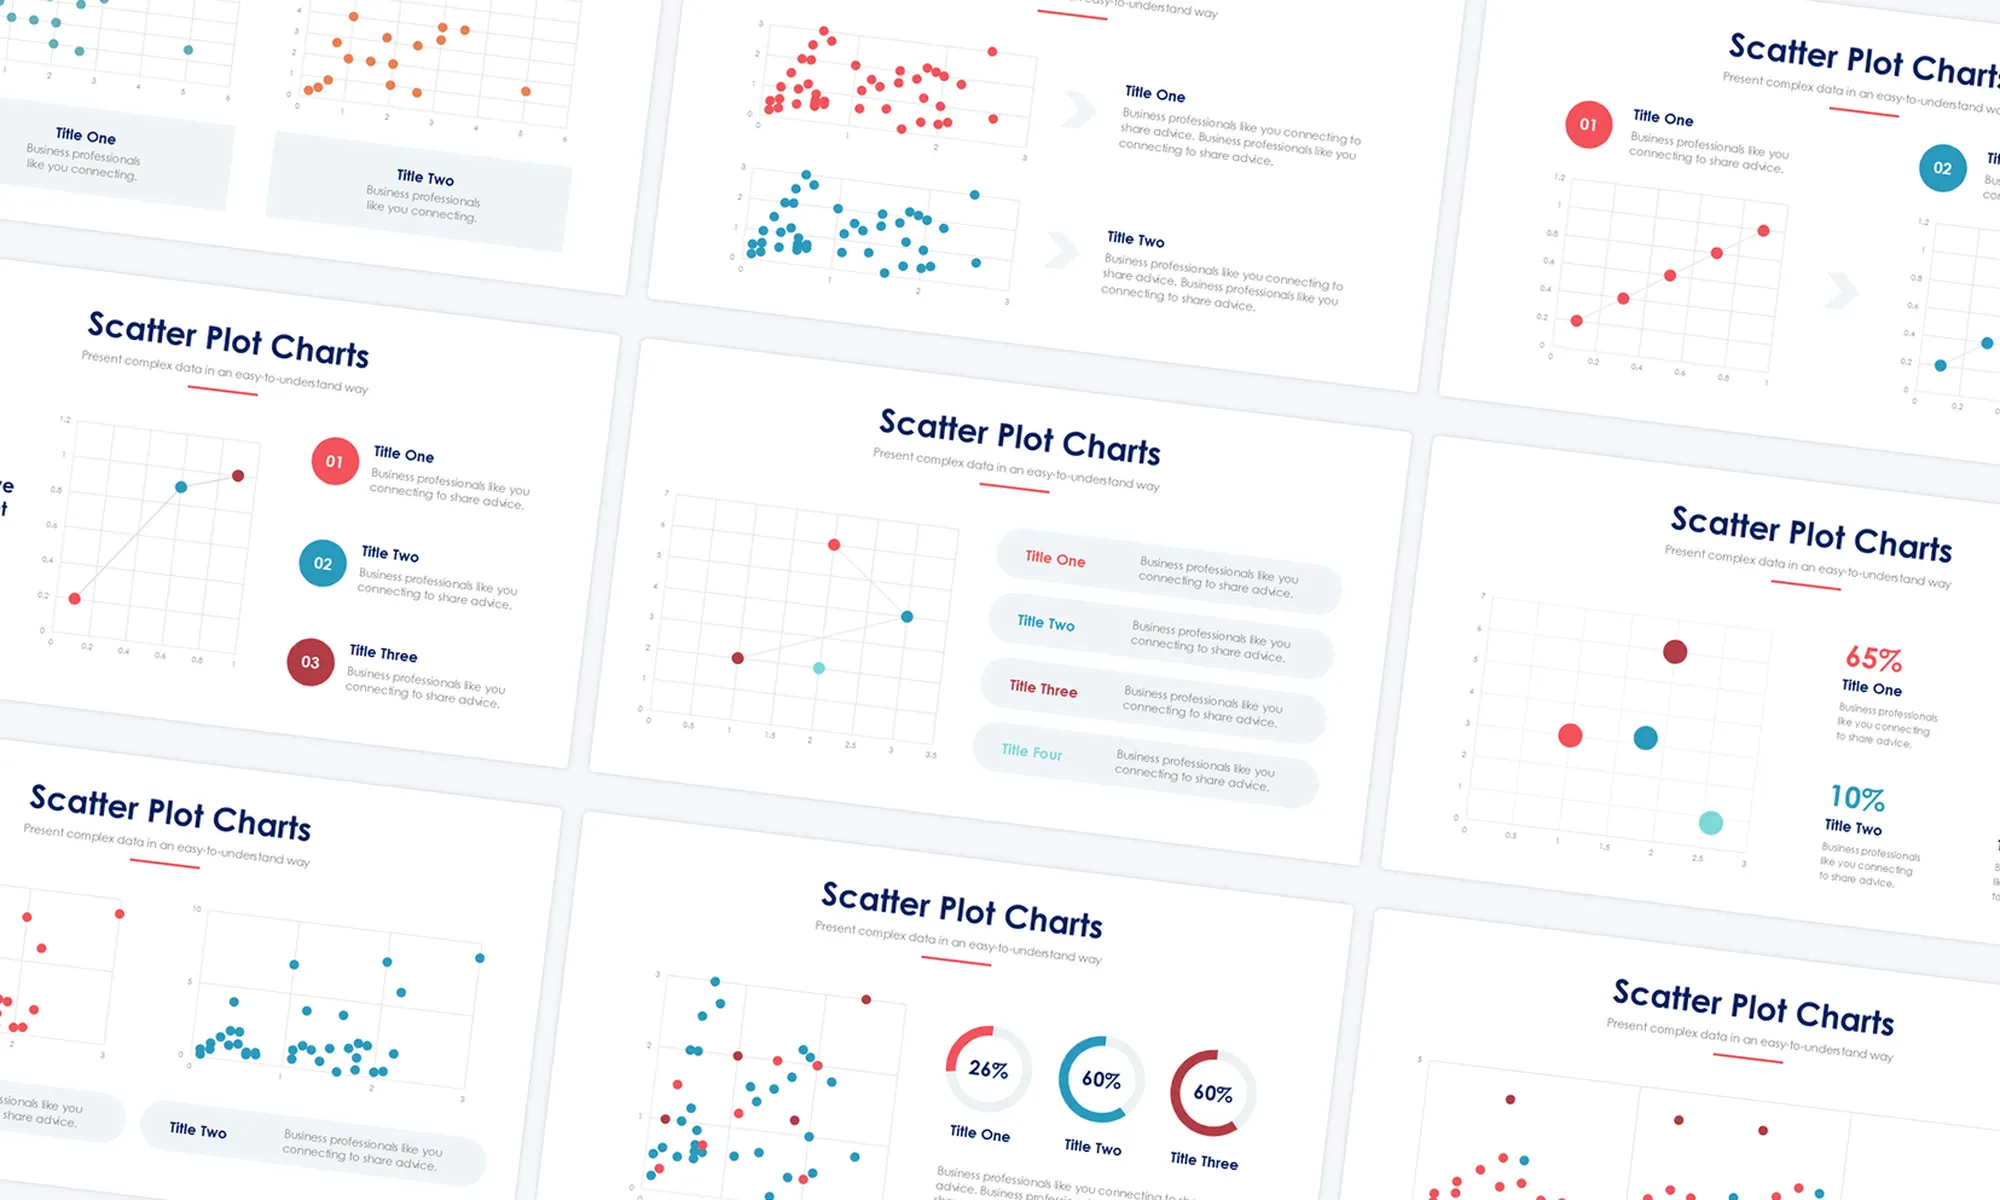
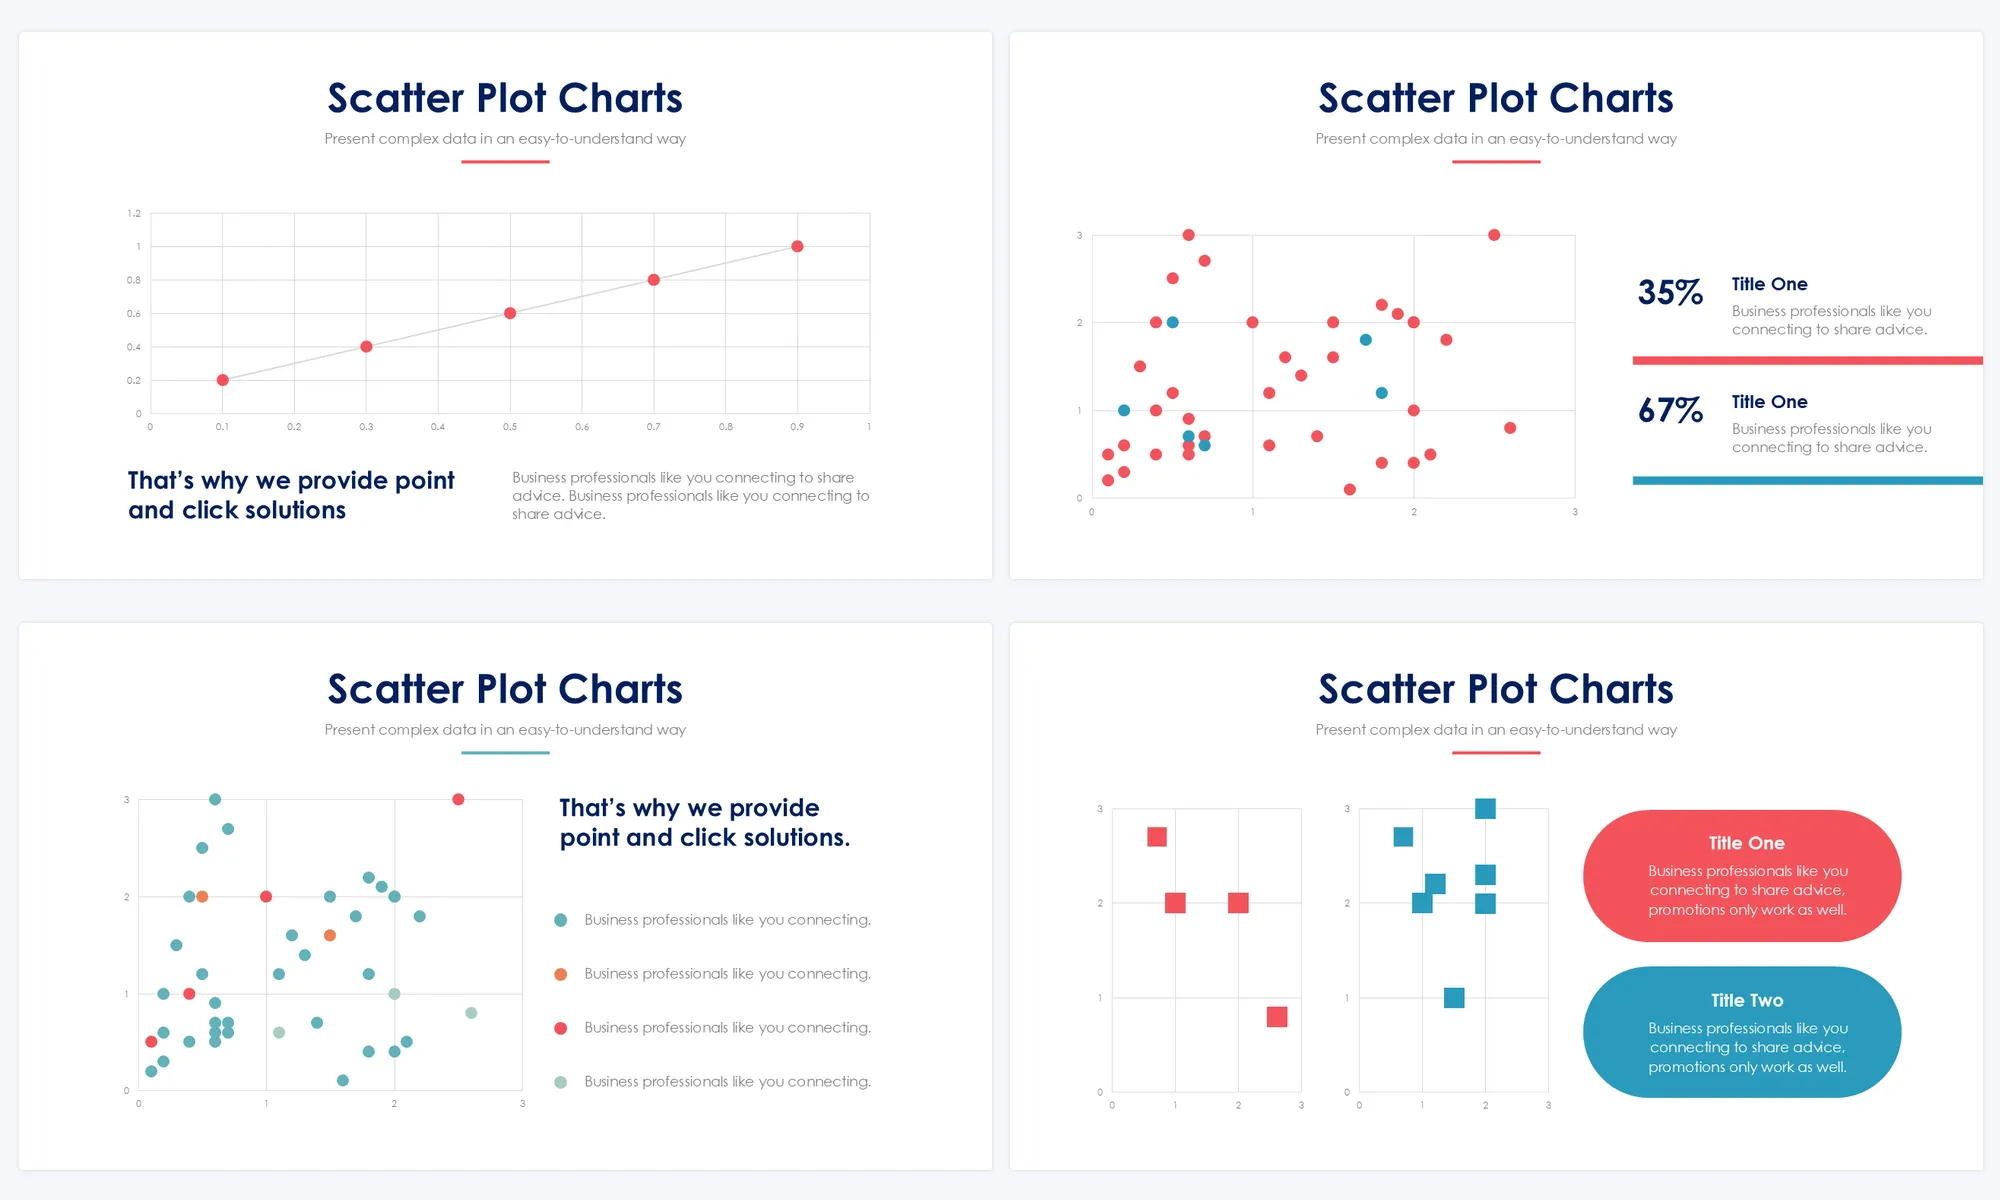
Illustrate correlations, data trends, or relationships between variables with Scatter Plot Charts. Present scatter plots showcasing data points, correlations, trend lines, or statistical relationships between variables using visuals and explanatory content. These slides aid in analyzing data distributions.
Features:
This product is also included in the Full-Access Pass + FREE Lifetime Updates
Are you already Premium? sign in to access.
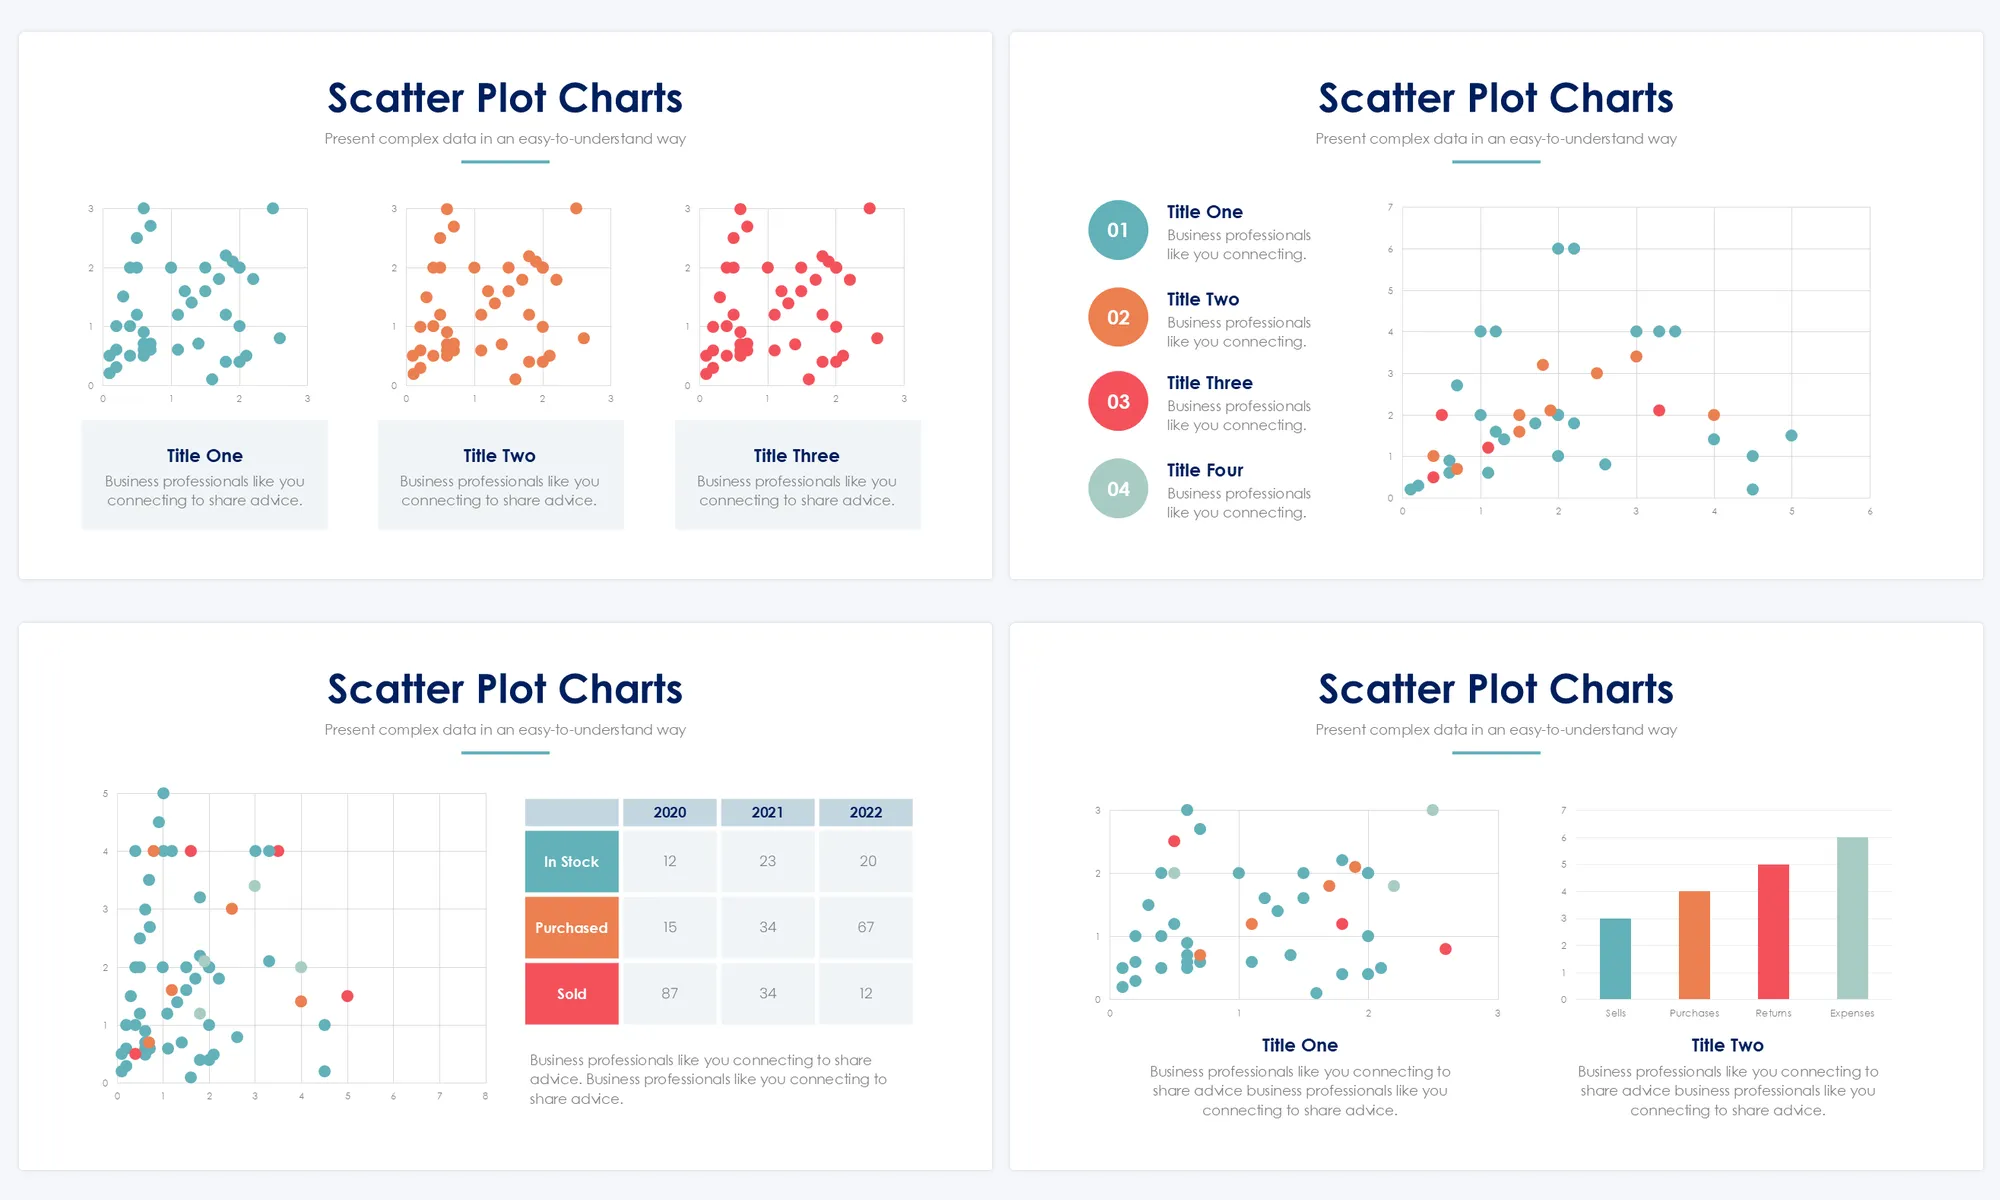
Illustrate correlations, data trends, or relationships between variables with Scatter Plot Charts. Present scatter plots showcasing data points, correlations, trend lines, or statistical relationships between variables using visuals and explanatory content. These slides aid in analyzing data distributions.
Features: